Image Details
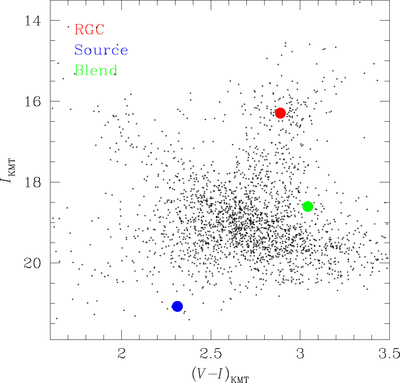
Caption: Figure 7.
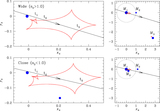
Positions of the source and blend with respect to the centroid of the red giant clump (RGC) in the instrumental color–magnitude diagram constructed based on the pyDIA photometry of the KMTNet BLG03 I- and V-band data.
Other Images in This Article
Copyright and Terms & Conditions
© 2020. The American Astronomical Society. All rights reserved.
Copyright ©
2025 Astronomy Image Explorer. All Rights Reserved.