Image Details
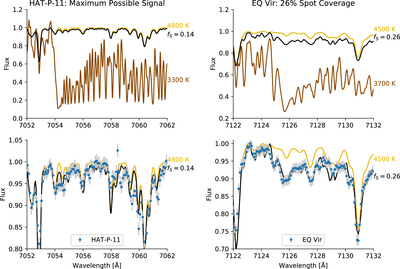
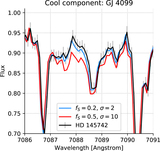
Caption: Figure 5.
Upper left: unspotted PHOENIX model spectrum with the effective temperature of HAT-P-11 (gold) compared with the model spectrum of a cooler star with ΔT = 1500 K (brown). We take the flux-weighted linear combination of the hot and cool components with 14% spot coverage—the maximum coverage observed in Morris et al. (2018d)—to produce the expected spectrum of the spotted star HAT-P-11 (black). Here we assume the most optimistic (and unrealistic) scenario that spots are entirely composed of spot umbrae with temperature difference from the photosphere ΔT = 1500 K for illustrative purposes. In this work, we try to measure the small flux deficit near the TiO bandhead at 7054 Å in the black curve. Lower left: zoom in on the difference between the unspotted and spotted composite spectrum (gold and black, respectively), compared with the observed echelle spectrum of HAT-P-11 (blue points). The scatter in the fluxes measured at each wavelength is comparable to the difference between the unspotted and spotted composite models, suggesting that the technique may only marginally detect spot coverage, if any, even in this extreme scenario. Right column: same plot for EQ Vir over a different TiO bandhead, with fS = 0.26 and spots with ΔT = 800 K, showing clearer evidence for spot coverage.
Other Images in This Article

Copyright and Terms & Conditions
© 2019. The American Astronomical Society. All rights reserved.