Image Details
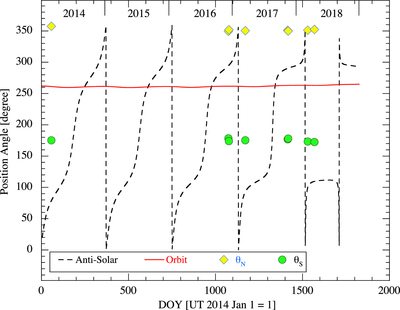
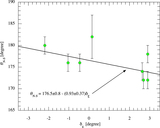
Caption: Figure 4.
Time dependence of the position angles of the north (yellow diamonds) and south (green circles) coma extensions from 2014 to 2018. The solid red curve shows the position angle of the projected orbit. The dashed black curve shows the position angle of the projected antisolar direction.
Other Images in This Article
Copyright and Terms & Conditions
© 2019. The American Astronomical Society. All rights reserved.
Copyright ©
2026 Astronomy Image Explorer. All Rights Reserved.