Image Details
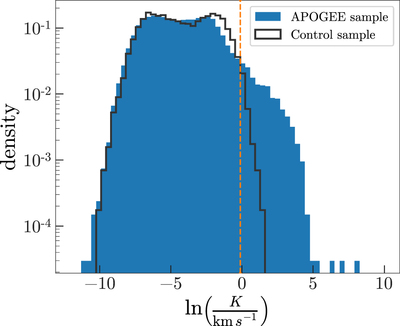
Caption: Figure 4.
Distribution of first percentiles in ﹩\mathrm{ln}K﹩ (in units of ﹩\mathrm{km}\,{{\rm{s}}}^{-1}﹩) for the parent APOGEE sample (blue, filled) and for the comparison sample (solid, dark line). The vertical line (dashed, orange) indicates our adopted cut to select high-K stars that likely have companions at ﹩\mathrm{ln}K=-0.2;﹩ 1% of the comparison sample falls above this cut.
Other Images in This Article
Show More
Copyright and Terms & Conditions
© 2018. The American Astronomical Society. All rights reserved.
Copyright ©
2026 Astronomy Image Explorer. All Rights Reserved.