Image Details
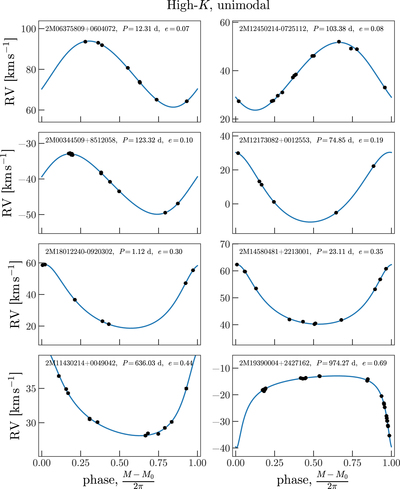
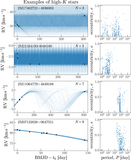
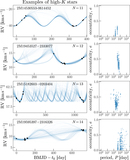
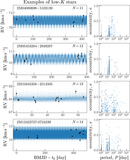
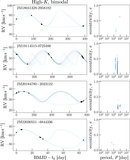
Caption: Figure 16.
Randomly selected examples of high-K stars with effectively unimodal posterior samplings and converged MCMC samplings. Each panel shows the data (black markers), phase-folded at the period of the posterior sample with maximum posterior probability. Visit velocity uncertainties are shown as black error bars (these are typically smaller than or equal to the size of the markers), and the inferred jitter as gray, capped error bars. The line (blue) shows the orbit computed from the posterior sample with maximum posterior probability.
Other Images in This Article
Show More
Copyright and Terms & Conditions
© 2018. The American Astronomical Society. All rights reserved.
Copyright ©
2026 Astronomy Image Explorer. All Rights Reserved.