Image Details
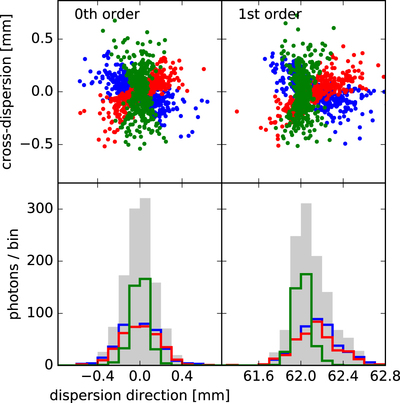
Caption: Figure 2.
Top: photon positions on the detector. Bottom: histogram of the distribution in dispersion direction. Colors match the color of the dots in the top row and respective diffraction gratings in Figure 1. The gray blocks show the summed histogram. Left: zeroth order. Right: first order. Note that this figure displays a simulation with a larger number of photons than Figure 1.
Other Images in This Article


Copyright and Terms & Conditions
© 2017. The American Astronomical Society. All rights reserved.
Copyright ©
2026 Astronomy Image Explorer. All Rights Reserved.