Image Details
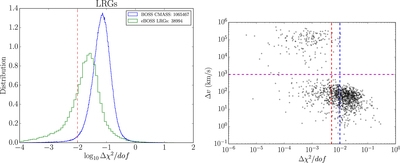
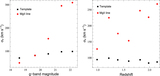
Caption: Figure 6.
Left: the distribution of Δχ2 per degree of freedom for the BOSS sample of CMASS galaxies and the eBOSS LRG sample. The χ2 per degree of freedom value represents the difference between the best fit spectral template and the second best spectral template when quasar templates are excluded from the fits. Right: a scatter plot showing the difference in redshift (km s−1) between pairs of observations taken of the same LRG target. The two vertical lines represent threshold for the current ﹩{\rm{\Delta }}{\chi }^{2}\;﹩ ZWARNING_NOQSO (blue) and the more lenient threshold that increases the rate of redshifts that are considered reliable (red). The horizontal line (magenta) represents the limit at which redshift discrepancy is considered a catastrophic failure.
Other Images in This Article

Show More
Copyright and Terms & Conditions
© 2016. The American Astronomical Society. All rights reserved.