Image Details
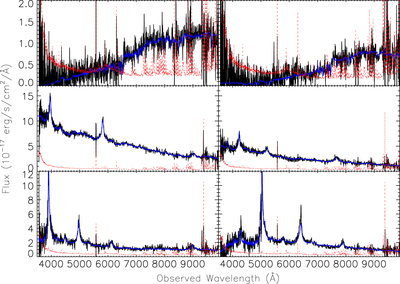
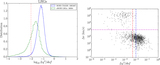
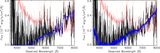
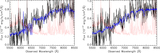
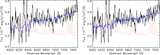
Caption: Figure 5.
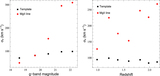
Examples of SEQUELS spectra that span the range of redshifts expected in the LRG, clustering quasar, and Lyα forest quasar samples. In each, the data are represented in black, the flux errors on each pixel in red, and the template in blue. A boxcar smoothing kernel of width 5 pixels has been applied to the data for illustrative effect. Each spectrum is classified with high confidence by the automated data reduction pipeline. Top left: an LRG at z = 0.64. Top right: an LRG at z = 0.88. Middle left: a quasar at z = 1.08 identified by the QSO_CORE selection algorithm. Middle right: a quasar at z = 1.74 identified by the QSO_CORE selection algorithm. Bottom left: a quasar at z = 2.21 identified by the QSO_CORE selection algorithm. Bottom right: a quasar at z = 3.15 identified by variability in the PTF imaging data.
Other Images in This Article

Show More
Copyright and Terms & Conditions
© 2016. The American Astronomical Society. All rights reserved.