Image Details
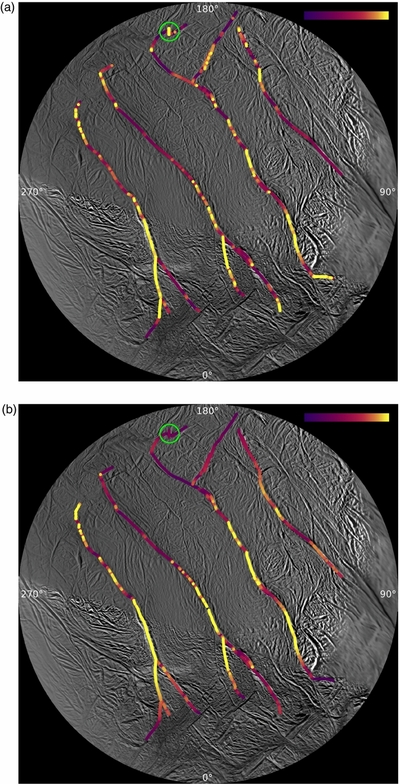
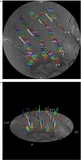
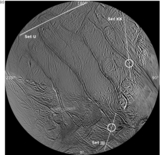
Caption: Figure 6.
(a) ISS basemap of the SPT on which has been plotted the color-coded relative magnitudes of predicted time-averaged shear stresses. Yellow is the largest, and purple is the smallest. An isolated region of high shear stress is circled. (b) ISS basemap of the SPT on which has been plotted the color-coded relative magnitudes of predicted maximum normal stresses. Yellow is the largest, and purple is the smallest. See the text.
Other Images in This Article
Show More
Copyright and Terms & Conditions
© 2014. The American Astronomical Society. All rights reserved.
Copyright ©
2026 Astronomy Image Explorer. All Rights Reserved.