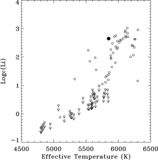
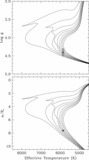
Image Details
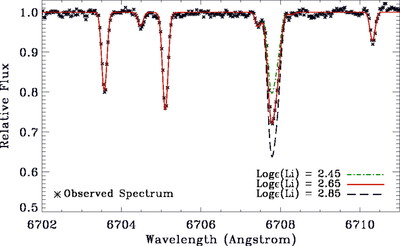
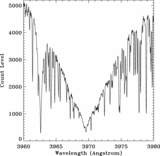
Caption: Fig. 2.
Top: A 10 Å region of the Keck template spectrum of TrES‐2 centered on the Ca II H line. Bottom: A portion of the same spectrum containing the Li I line at 6707.8 Å (filled dots), compared to three synthetic profiles (lines of various colors and styles), each differing only in the lithium abundance assumed.
Other Images in This Article

Copyright and Terms & Conditions
© 2007. The American Astronomical Society. All rights reserved. Printed in U.S.A.
Copyright ©
2025 Astronomy Image Explorer. All Rights Reserved.