Image Details
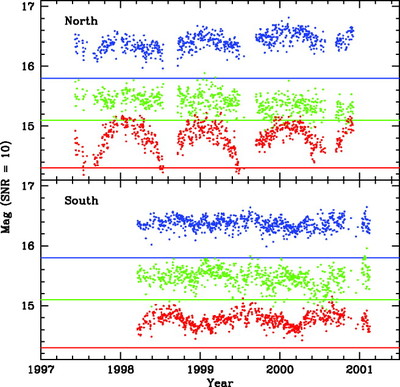
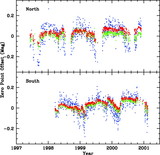
Caption: Fig. 6.
Achieved mean nightly J (blue), H (green), and Ks (red) ﹩\mathrm{S}\,/ \mathrm{N}\,=10﹩ sensitivity levels in magnitudes vs. time for the two 2MASS observatories. This sensitivity is calculated from the statistics of repeated observations of stars in each set of hourly calibration observations. The solid horizontal lines represent the survey’s ﹩\mathrm{S}\,/ \mathrm{N}\,=10﹩ sensitivity requirement in each band: ﹩J=15.8﹩, ﹩H=15.1﹩, and ﹩K_{s}=14.3﹩.
Other Images in This Article

Show More
Copyright and Terms & Conditions
© 2006. The American Astronomical Society. All rights reserved. Printed in U.S.A.
Copyright ©
2025 Astronomy Image Explorer. All Rights Reserved.