Image Details
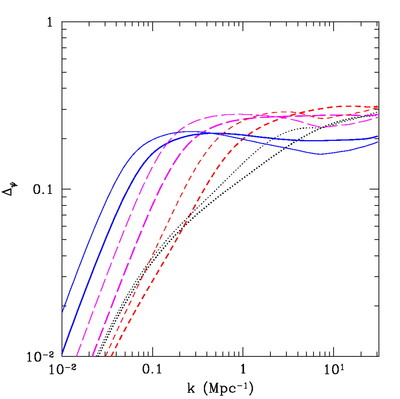
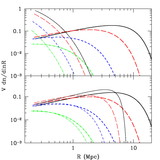
Caption: Fig. 10.
Redshift evolution of Δψ in the ﹩\zeta =500﹩ (thin lines) and ﹩\zeta =90﹩ (thick lines) models. In the latter case, we decrease mmin by an order of magnitude from the default model. The curves are for ﹩\overline{x}_{\mathrm{H}\,}=0.96﹩ (dotted), ﹩\overline{x}_{\mathrm{H}\,}=0.8﹩ (short‐dashed), ﹩\overline{x}_{\mathrm{H}\,}=0.5﹩ (long‐dashed), and ﹩\overline{x}_{\mathrm{H}\,}=0.24﹩ (solid). The redshifts in the two models differ slightly.
Other Images in This Article


Show More
Copyright and Terms & Conditions
© 2004. The American Astronomical Society. All rights reserved. Printed in U.S.A.
Copyright ©
2025 Astronomy Image Explorer. All Rights Reserved.