Image Details
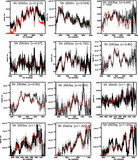
Caption: Fig. 2.
Multicolor light curves of SNe Ia. For each SN Ia, multicolor photometry transferred to rest‐frame passbands is plotted. The individual, best‐fit MLCS2k2 model is shown as a solid line, with a ±1 σ model uncertainty, derived from the model covariance matrix, above and below the best fit.
Other Images in This Article
Show More
Copyright and Terms & Conditions
© 2004. The American Astronomical Society. All rights reserved. Printed in U.S.A.
Copyright ©
2026 Astronomy Image Explorer. All Rights Reserved.