Image Details
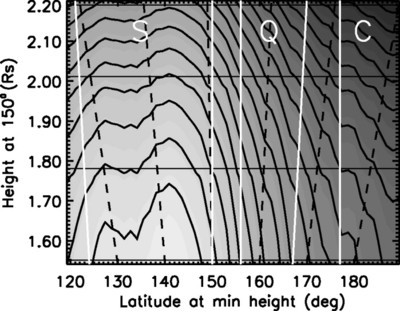
Caption: Fig. 1.
Left: Composite LASCO C2 and EIT image from June 21. Solid white lines indicate positions of the UVCS slit. Dotted white lines indicate latitude. Right: Lyα intensity interpolated into a contour plot of the observed region. Streamer, quiet‐Sun, and coronal‐hole regions are labeled "S," "Q," and "C" and are bounded by the white lines. The dashed lines are lines of constant latitude. Higher intensities have lighter shading. The intensity contours start at ﹩\mathrm{\log}_{10}11.3﹩ photons s−1 Ω−1 cm−2 Å−1 at the lowest height and decrease by ﹩\mathrm{\log}_{10}0.065﹩ photons s−1 Ω−1 cm−2 Å−1.
Other Images in This Article
Show More
Copyright and Terms & Conditions
© 2004. The American Astronomical Society. All rights reserved. Printed in U.S.A.