Image Details
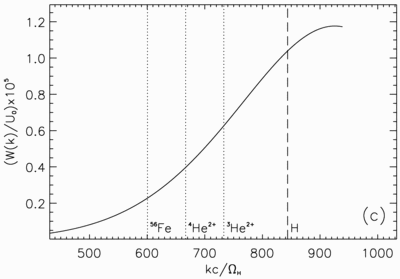
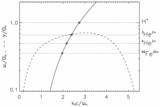
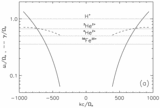
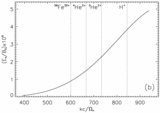
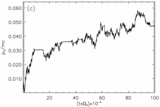
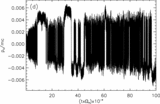
Caption: Fig. 4.
Properties of the wave spectrum assumed for the test particle simulations. (a) Dispersion of the wave field used for the test particle simulation obtained from linearized theory. Each branch (positive and negative k) consists of 1000 monochromatic waves. The dotted lines indicate the resonance frequencies of the corresponding ions. (b) Electric field amplitudes of the wave spectrum at the end of the growth time. The vertical dotted lines refer to the k‐values corresponding to the associated ion gyrofrequencies. (c) Corresponding spectral energy density.
Other Images in This Article
Show More
Copyright and Terms & Conditions
© 2003. The American Astronomical Society. All rights reserved. Printed in U.S.A.
Copyright ©
2025 Astronomy Image Explorer. All Rights Reserved.