Image Details
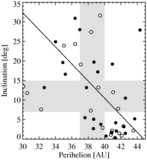
Caption: Fig. 3.
Color vs. inclination for the constant q subsample (left) and color vs. perihelion for the constant i subsample (right). The left panel corresponds to 2.8 σ, and the right panel is not significant, as estimated by the Spearman rank correlation method. The constant perihelion subsample (left) indicates that the inclination/color correlation is not due to observational bias. In contrast, the constant i subsample lacks any trend, indicating that the observed perihelion/color correlation is most likely due to sampling bias induced by the perihelion/inclination correlation.
Other Images in This Article
Copyright and Terms & Conditions
© 2002. The American Astronomical Society. All rights reserved. Printed in U.S.A.
Copyright ©
2025 Astronomy Image Explorer. All Rights Reserved.