Image Details
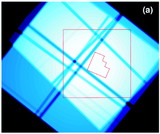
Caption: Fig. 3.
Raw X‐ray images in the (a) 0.5–2 keV (soft) band and (b) 2–8 keV (hard) band. The area shown matches the Caltech area indicated on the exposure map in Fig. 1. The outlined region is the HDF‐N, and the crosses mark the centers of each of the Hubble Flanking Fields (see Table 2 of W96).
Other Images in This Article

Show More
Copyright and Terms & Conditions
© 2001. The American Astronomical Society. All rights reserved. Printed in U.S.A.
Copyright ©
2025 Astronomy Image Explorer. All Rights Reserved.