262 images found
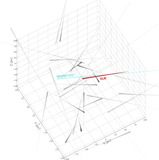
The best-fitted trajectory from TIPSY, as discu...
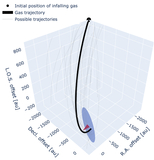
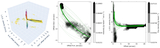
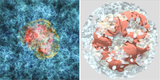
Isometric projection of the best-fit infalling ...
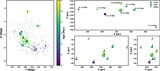
Interactive figure showing stellar and gas loca...
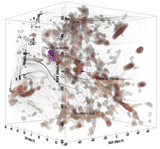
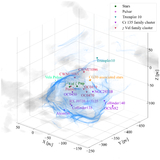
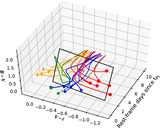
3D visualization of the mean density and peculi...
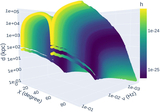
Maximum detectable distance d by LISA for WDs W...

Example figure of ρLGRB(z) in 1 + z space. The ...
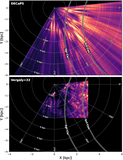
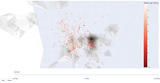
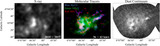
Top-down view of DECaPS 3D dust map (top) along...
Comparison of the DECaPS dust map (top panel) a...
Comparison of BRAINS output for the full state ...
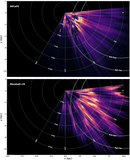
Left: 3D rendering of SNRs in the cloudy inters...
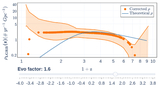
Example figure of ρLGRB(z) in 1 + z space. The ...
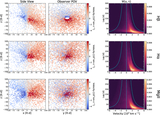
Left panel: white-light observations provided b...
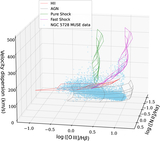
The distribution of MUSE IFU data for NGC 5728 ...
The distribution of MUSE IFU data for NGC 5728 ...
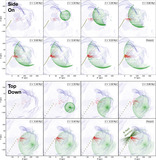
A series of top-down views in the x–y plane, il...
The fiducial model of the IVS (based on the pea...
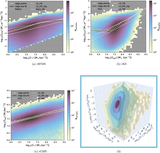
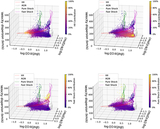
(a–c) The rSFMS, rKS, and rGMS scaling relation...
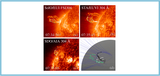
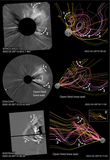
Splitting filament on 2022 October 28 seen by S...
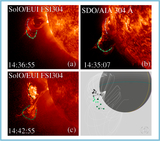
Splitting filament of 2023 February 5 seen by S...
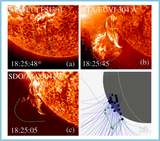
Splitting filament on 2023 October 15 seen by S...
Proposed scenario for the formation of the CLIC...
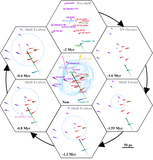
The orbital histories (over the past 3 Myr, sho...
In the left panel, a sky-coordinate map of the ...
B − V (z-axis) and V − i (y-axis) multicolor ev...
ANNOUNCEMENTS
Take the AstroExplorer for a spin!
Be sure to try the search and sorting features, which were added based on user feedback; browse and find the links to videos and interactive figures in our Journal articles; find AAS Research Notes; or notice that new publishers have begun adding their figures to the AIE. Get in touch to hear more!