Image Details
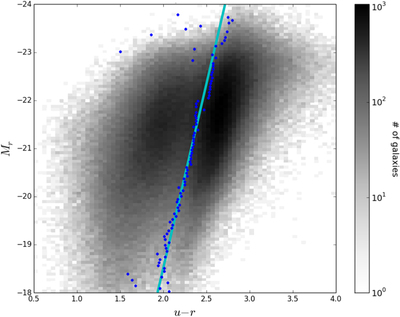
Caption: Figure 1.
Color–magnitude diagram (u − r vs. M r ) for the SDSS galaxy sample. Blue dots are the optimal 〈u − r〉 for each absolute magnitude bin. Cyan line is the linear color divider.
Copyright and Terms & Conditions
© 2022. The Author(s). Published by the American Astronomical Society.
Copyright ©
2025 Astronomy Image Explorer. All Rights Reserved.