Image Details
Caption: Figure 1.
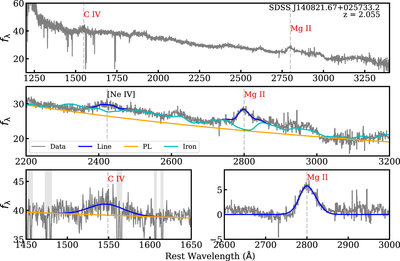
Top: the extinction-corrected BOSS spectrum. Middle and Bottom left: the spectral fit for the C IV and Mg II regions. Bottom right: continuum-subtracted Mg II profile and fit. The light gray bands denote the masked narrow absorption lines.
Copyright and Terms & Conditions
© 2021. The Author(s). Published by the American Astronomical Society.
Copyright ©
2025 Astronomy Image Explorer. All Rights Reserved.