Image Details
Caption: Figure 1.
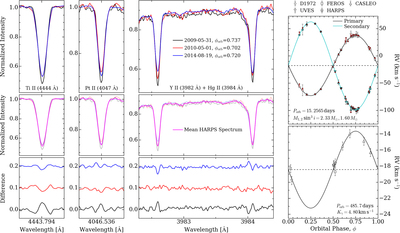
Left: line profile variability of various elements registered in the HARPS spectra obtained on three different observing epochs, in 2009, 2010, and 2014 (top panel). The mean profiles are presented in the middle panels. The bottom panel illustrates the differences between the mean profiles and individual line profiles shifted upward for better visibility. Right: orbital solutions for the SB2 system (top) and the wide system (bottom).
Copyright and Terms & Conditions
© 2020. The American Astronomical Society. All rights reserved.
Copyright ©
2025 Astronomy Image Explorer. All Rights Reserved.