Image Details
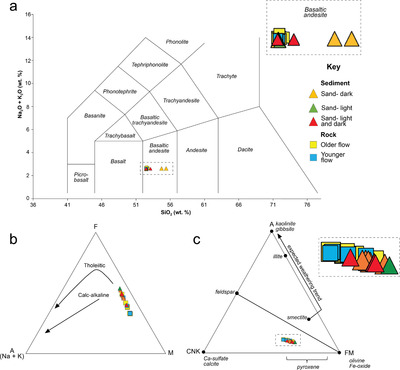
Caption: Figure 13.
Geochemical trends from APXS and SuperCam LIBS data. (a) TAS diagram showing the distribution of all rock and sediment targets in the basaltic andesite field. Inset zoomed-in view shown in the larger dashed box. (b) Alkali–iron–magnesium (FAM) ternary diagram showing tholeiitic and calc–alkaline trends for reference. (c) Al2O3 – CaO + Na2O + K2O – FeO(T) + MgO (A–CNK–FM) ternary diagram showing the distribution of all rock and sediment targets compared to representative mineral phases and the typical mafic chemical weathering trend.
Other Images in This Article


Show More
Copyright and Terms & Conditions
© 2024. The Author(s). Published by the American Astronomical Society.
Copyright ©
2025 Astronomy Image Explorer. All Rights Reserved.