Image Details

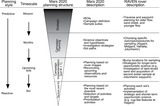
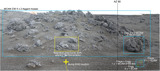
Caption: Figure 11.
Comparison of the rover and helicopter missions. (a) Chart showing the distribution of each phase for the rover (black) and helicopter (white) missions. (b) Chart showing the allotment of resources for the rover (red) and helicopter (blue) missions. Tonal differences correspond to percentage values, which are also listed in Table 6.
Other Images in This Article


Show More
Copyright and Terms & Conditions
© 2024. The Author(s). Published by the American Astronomical Society.
Copyright ©
2025 Astronomy Image Explorer. All Rights Reserved.