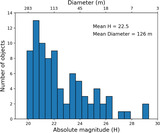
Image Details
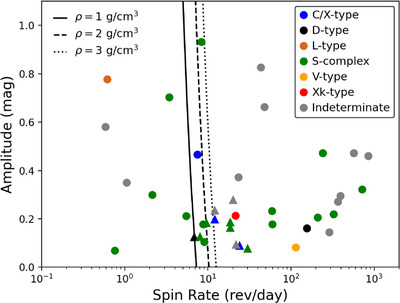
Caption: Figure 22.
Amplitude vs. spin rate for the NEOs included in the photometric study. Taxonomic types are indicated with different colors. Objects whose amplitudes and spin rates were determined in this study (or previous work) are depicted with circles. Objects for which only a lower limit for the amplitude and spin rate was calculated are depicted with triangles. The curves represent the critical spin rate for bulk densities (ρ) of 1.0, 2.0, and 3.0 g cm−3. Figure adapted from Pravec & Harris (2000).
Other Images in This Article

Show More
Copyright and Terms & Conditions
© 2024. The Author(s). Published by the American Astronomical Society.
Copyright ©
2025 Astronomy Image Explorer. All Rights Reserved.