

Image Details
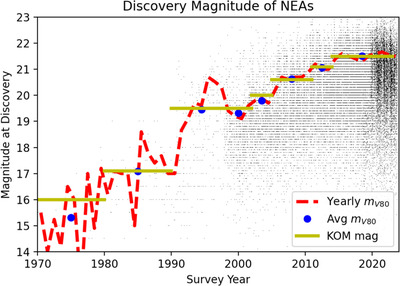
Caption: Figure 7.
The discovery epoch magnitude reported to the MPC for each NEA cataloged from 1970 to 2023. The yearly 80th percentile value of the discovery magnitude, m V 80, is given as a red dashed line, with the blue dots representing the average value of the m V 80 for each time period given in Table 2. The yellow lines represent the value of the magnitude used in the KOM from Table 2.
Other Images in This Article
Show More
Copyright and Terms & Conditions
© 2023. The Author(s). Published by the American Astronomical Society.

Copyright ©
2026 Astronomy Image Explorer. All Rights Reserved.
