Image Details
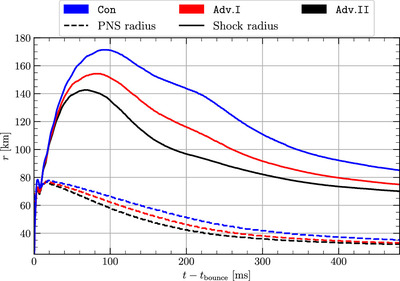
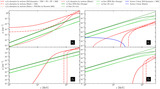
Caption: Figure 9.
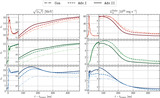
Time evolution of the radius of PNS (dashed lines), which is defined as the radius for ρ > 1011 g cm−3 and the shock radius (solid lines), which is defined as the radius from the center to the position where the velocity is minimum. Lines with blue, red, and black colors represent the radii of the simulations of Con, Adv.I, and Adv.II, respectively. Results of Adv.II exhibit the shortest shock radius and PNS radius, primarily because of the rapid cooling of external ν x emissions through ﹩{\nu }_{e}{\bar{\nu }}_{e}﹩ pair annihilation and the kernel forms of other pair processes.
Other Images in This Article
Copyright and Terms & Conditions
© 2024. The Author(s). Published by the American Astronomical Society.