Image Details
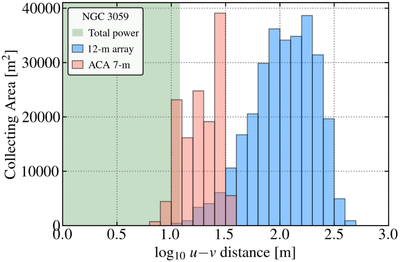
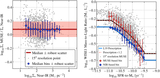
Caption: Figure 25.
PHANGS–ALMA distribution of collecting area vs. u−v distance for individual integrations. For the same pointings in Figure 24, we show the distributions of collecting area vs. log10 u−v baseline length for individual integrations from the 12 m array (blue) and 7 m array observations (red). The figure illustrates good overlap between the three components of ALMA and good sensitivity to a range of spatial scales. Note that the shaded total power region only indicates the u−v range of the total power antennas, not the amount of collecting area.
Other Images in This Article
Show More
Copyright and Terms & Conditions
© 2021. The American Astronomical Society. All rights reserved.
Copyright ©
2026 Astronomy Image Explorer. All Rights Reserved.