Image Details
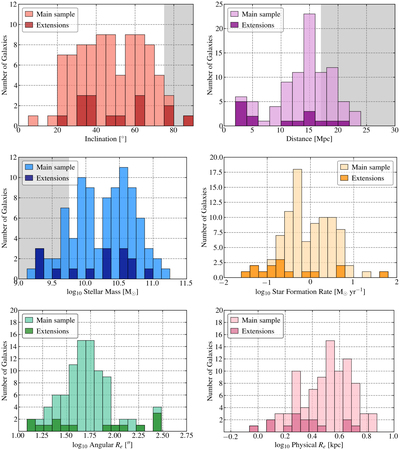
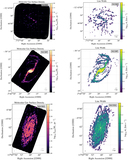
Caption: Figure 16.
Histograms showing PHANGS–ALMA sample properties. The top row shows inclination and distance. Inclinations come mostly from Lang et al. (2020) and we adopt distances from Anand et al. (2021). The second row shows stellar mass (Section 4.3) and star formation rate (Section 4.5). The third row shows the stellar half-mass radii (Section 4.4) in both angular and physical units. In panels relevant to sample selection, gray shading marks the region excluded by the main sample selection (Section 3). Note that our best estimates of each quantity have improved since selection, so that we selected some galaxies that we now believe miss the selection criteria. The darker histogram shows properties of galaxies in survey extensions that focus on early-type and very nearby galaxies.
Other Images in This Article
Show More
Copyright and Terms & Conditions
© 2021. The American Astronomical Society. All rights reserved.