Image Details

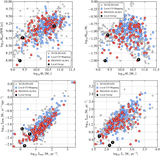
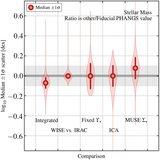
Caption: Figure 12.
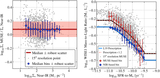
Comparisons among star formation rate estimates. Median (point), ±1σ scatter (error bar), and distribution (shaded violin plot) for the ratios among star formation rates estimated in various ways. In each case, we consider the ratio of some other estimate to our adopted estimate. From left to right, we compare our fiducial values (usually FUV+WISE4, see text) to “Integrated”: results using integrated photometry from Leroy et al. (2019), “NUV+W4”: results preferring the GALEX NUV band instead of FUV and hybridizing with WISE4, “FUV+W3”: results using WISE3 instead of WISE4, “NUV+W3” same, but now using NUV and WISE3, “Just W3”: estimates based on only WISE3 emission, “Just W4”: estimates based on only WISE4 emission, and “MUSE ΣSFR”: estimates based on Balmer-decrement-corrected Hα emission from PHANGS–MUSE. Unlike the other estimates, which are all compared for whole galaxies, the MUSE ΣSFR comparison considers each 15″ line of sight. See also Table 8.
Other Images in This Article
Show More
Copyright and Terms & Conditions
© 2021. The American Astronomical Society. All rights reserved.