Image Details
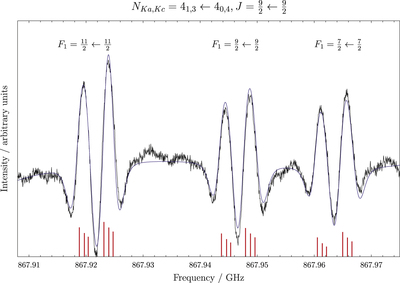
Caption: Figure 2.
Recording (black trace) of the ﹩{N}_{{K}_{a},{K}_{c}}={4}_{\mathrm{1,3}}\leftarrow {4}_{\mathrm{0,4}},J=9/2\leftarrow 9/2﹩ fine-structure transitions showing six resolvable components. Integration time: 390 s; RC = 3 ms; scanning rate: 1.3 MHz s−1; modulation depth: 850 kHz. The blue trace plots the modeled spectrum computed with proFFiT using a modulated Voigt profile (see the text). The red sticks indicate the position and relative intensity of the 18 hyperfine components. Note that the F2 and F quantum numbers are not shown in the plot.
Other Images in This Article
Copyright and Terms & Conditions
© 2020. The American Astronomical Society. All rights reserved.
Copyright ©
2025 Astronomy Image Explorer. All Rights Reserved.