Image Details
Caption: Figure 1.
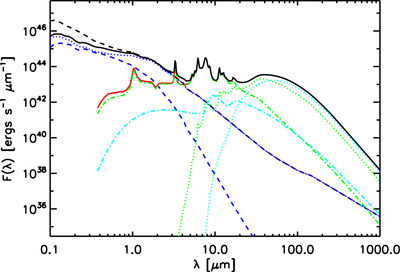
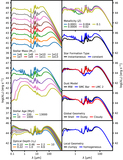
Example global SED for a young (10 Myr) stellar population, with a stellar mass of 1010 M☉, Milky Way type dust, a 10 kpc radius, a Shell geometry, and an optical depth of ﹩{\tau }_{v}=1﹩. The dashed black line is the input stellar SED. The solid black, blue, and red lines are the total output SED, the radiative transfer component (extinguished plus scattered), and the total dust emission. The dotted and dashed components give the direct and scattered stellar component of the radiative transfer component. Among the dust emission components, the green and light blue lines represent carbonaceous and silicate grains; the dotted and dashed-dotted lines represent equilibrium and stochastic dust emission, respectively.
Other Images in This Article

Copyright and Terms & Conditions
© 2018. The American Astronomical Society. All rights reserved.