Image Details
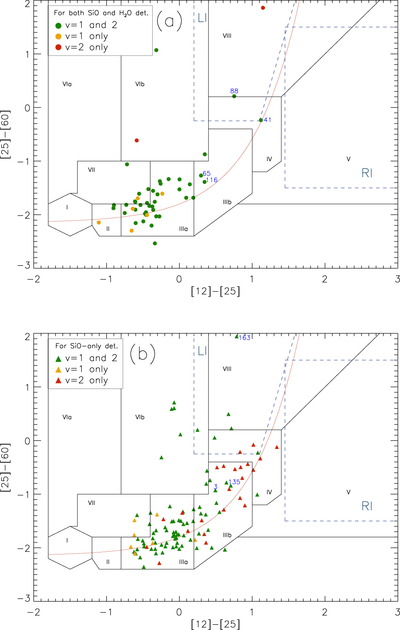
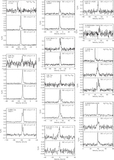
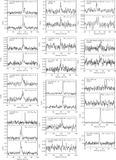
Caption: Figure 7.
(a) Distributions of SiO v = 1 and/or v = 2 maser detections for both H2O and SiO maser detected OH/IR stars in the IRAS two-color diagram. The red line is the evolutionary sequence for AGB stars defined by van der Veen & Habing (1988). The blue dashed line indicates the two groups of post-AGB stars, LI (left of IRAS, blue group) and RI (right of IRAS, red group) (Sevenster 2002a). The green circles indicate both SiO v = 1 and v = 2 maser detected sources, and the yellow circles and the red circles indicate SiO v = 1-only maser detected sources and v = 2-only detected sources, respectively. (b) Distributions of the SiO v = 1 and/or v = 2 maser detections for SiO-only maser detected OH/IR stars. The green triangles indicate both SiO v = 1 and v = 2 maser detected sources, and the yellow triangles and the red triangles indicate SiO v = 1-only maser detected sources and v = 2-only detected sources, respectively.
Other Images in This Article
Show More
Copyright and Terms & Conditions
© 2017. The American Astronomical Society. All rights reserved.