Image Details
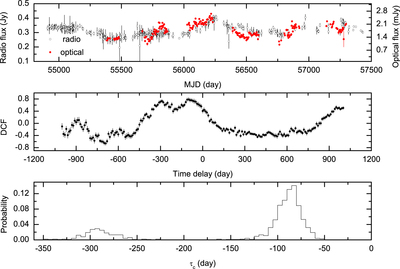
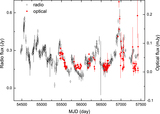
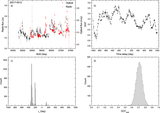
Caption: Figure 3.
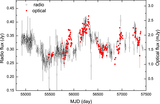
Upper panel: the radio and optical light curves of blazar J1917-1921. The circles represent the radio light curve (the left scale), and the dots represent the optical light curve (the right scale). Middle panel: DCF between the radio and optical light curves for the blazar J1917-1921. Lower panel: the normalized distribution of τc’s obtained by 5000 simulations.
Other Images in This Article
Copyright and Terms & Conditions
© 2017. The American Astronomical Society. All rights reserved.
Copyright ©
2025 Astronomy Image Explorer. All Rights Reserved.