Image Details
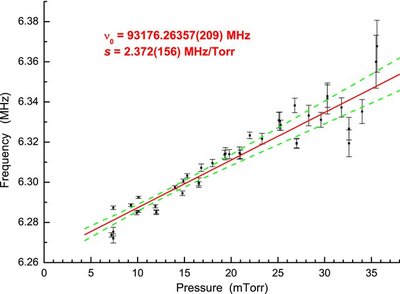
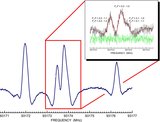
Caption: Figure 6.
Linear fit of the transition frequency vs. total pressure. For graphical reasons, the last digits of the frequency (93176.3 MHz) are reported on the y-axis only. Error bars are three times the uncertainties retrieved from the line profile analysis. Uncertainties given in parentheses are a one-time standard deviation of the fit.
Other Images in This Article
Copyright and Terms & Conditions
© 2012. The American Astronomical Society. All rights reserved.
Copyright ©
2025 Astronomy Image Explorer. All Rights Reserved.