Image Details
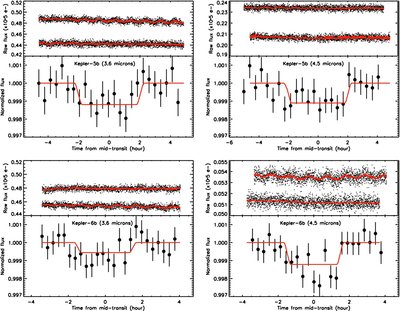
Caption: Figure 1.
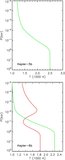
Top panels: Warm-Spitzer raw occultation light curves of Kepler-5b (top row) and Kepler-6b (bottom row). These occultations were observed in the two IRAC bandpasses, at 3.6 (left side) and 4.5 μm (right side). The raw data are offset in flux for illustration purposes. The red solid lines correspond to the best-fit models which include the time and position decorrelations as well as the models for the planetary occultations (see details in Section 2.3). Bottom panels: de-correlated, normalized, combined, and binned per 20 minute occultation light curves (black data points with their 1σ error bars). The best fits are overplotted in red solid lines.
Other Images in This Article


Copyright and Terms & Conditions
© 2011. The American Astronomical Society. All rights reserved.