Image Details
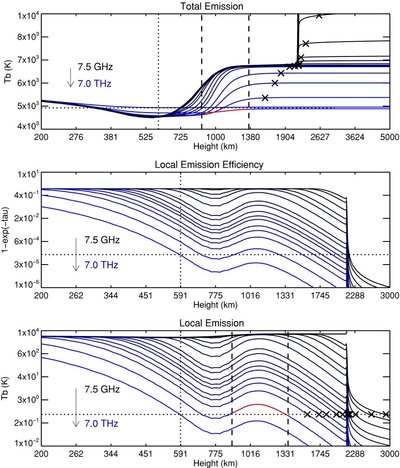
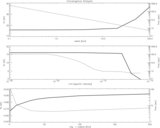
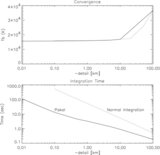
Caption: Figure 3.
Multi-frequency spectrum from 7.5 GHz (black or upper curve) to 7 THz (blue or lower curve). The total emission (upper panel), "emission efficiency" (middle panel), and local emission (bottom panel) as a function of height from the photosphere. The thick black line in the upper panel is the radial temperature model.
Other Images in This Article
Copyright and Terms & Conditions
© 2010. The American Astronomical Society. All rights reserved.
Copyright ©
2025 Astronomy Image Explorer. All Rights Reserved.