Image Details
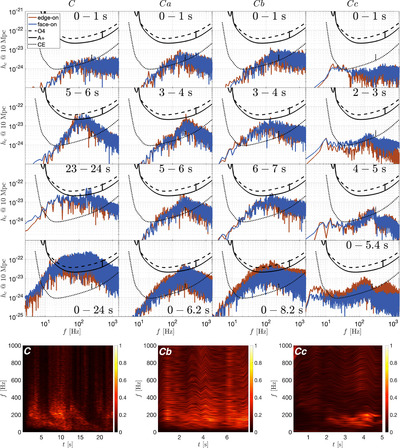
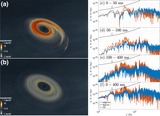
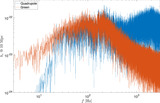
Caption: Figure 4.
Top: edge-on (red) and face-on (blue) spectra for models C (first column from left), Ca (second column), Cb (third column), and Cc (fourth column) are presented, with different rows depicting the spectra at various times. The black lines represent the sensitivity of various GW detectors. During the disk formation stage (first row), all models exhibit a quasi-flat spectrum. When cooling is strong (first three columns), Rossby vortices develop, leading to pronounced GW peak frequencies as the disk evolves. A movie showcasing the evolution of the GW spectrum is available at http://www.oregottlieb.com/disk_gw.html or on Zenodo (doi:10.5281/zenodo.13139529). Bottom: the spectrograms for face-on observers over a moving time window of 0.4 s illustrate the signal amplification after ≲1 s. The spectrogram of model Ca resembles that of C.
Other Images in This Article

Copyright and Terms & Conditions
© 2024. The Author(s). Published by the American Astronomical Society.