Image Details
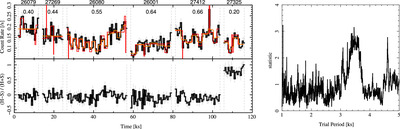
Caption: Figure 2.
Left top: the X-ray light curve of π Aqr for all observations for the 1.7–13 Å band, concatenated in time order. The vertical dashed lines mark arbitrary length gaps between observations. The black curve shows the count rate in dispersed first-order events. The red and orange curves show the results of Bayesian blocks (Scargle et al. 2013) and Gregory–Loredo (Gregory & Loredo 1992) algorithms, confirming the statistically significant variability. Left bottom: the count-rate hardness ratio, (H − S)/(H + S), where H is the “hard” rate in the 1.7–5.2 Å band and S in 5.2–13 Å for “soft.” The last observation (27325) does not stand out in the total rate curve but does in hardness. Labels at the top give the observation IDs with orbital phases below them. Right: epoch-folding algorithm (Davies 1990) “L” statistic for observation ID 26080 showing coherent variability with period near 3400 s.
Other Images in This Article
Copyright and Terms & Conditions
© 2024. The Author(s). Published by the American Astronomical Society.