Image Details
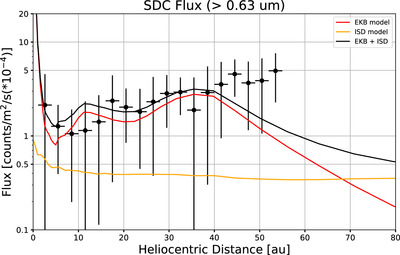
Caption: Figure 3.
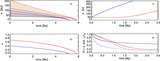
SDC flux estimates for particles with a radius greater than 0.63 μm from 1 to 55 heliocentric au. Each point, with 1σ error bars, is an average of the flux measured by each detector across each 3 au traversed by the New Horizons spacecraft. The orange curve represents the ISD flux values calibrated from Ulysses measurements (Bernardoni et al. 2022). While ISD grains are much smaller (∼0.28 μm), they are also traveling at higher relative velocities and, as a result, SDC interprets them as small IDPs (Bernardoni et al. 2022). The red line shows a model from Poppe (2016) that is normalized to the SDC measurements and assumes SDC is impacted only by IDPs. The black line is a sum of the orange and red models to provide a more representative model of the total flux that SDC is measuring up to 42 au.
Other Images in This Article
Copyright and Terms & Conditions
© 2024. The Author(s). Published by the American Astronomical Society.