Image Details
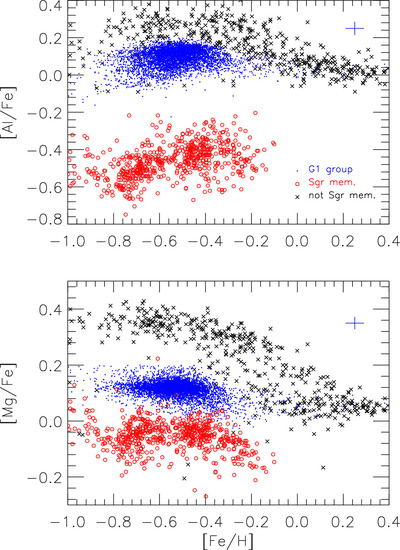
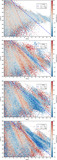
Caption: Figure 3.
The comparison of the G1 group (blue dots) with Sgr member (red open circles, [Al/Fe] < − 0.2 dex) and non-Sgr (crosses, [Al/Fe] > − 0.2 dex) groups in the [Fe/H] vs. [Al/Fe] (upper) and [Mg/Fe] (lower) diagrams.
Other Images in This Article

Copyright and Terms & Conditions
© 2024. The Author(s). Published by the American Astronomical Society.
Copyright ©
2025 Astronomy Image Explorer. All Rights Reserved.