Image Details
Caption: Figure 4.
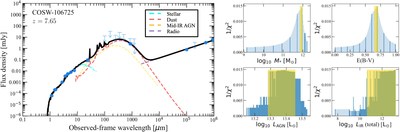
Left panel: optical-IR-radio SED fitting with BC03 stellar (Bruzual & Charlot 2003), mid-IR AGN (Mullaney et al. 2011), Draine & Li dust (Draine & Li 2007), and power-law radio templates (using the MICHI2 code; Liu et al. 2021). The black line indicates the composite best-fit model, and the blue symbols are photometric data points, with upper limits shown as downward arrows. The stellar, mid-IR AGN, dust, and radio components are indicated by the cyan, yellow, red, and magenta dashed lines, respectively. Right panels: the 1/ χ 2 distributions from the fitting for the four parameters: stellar mass, dust attenuation E(B − V), AGN component’s luminosity integrated over 10–1000 μm, and dust component’s luminosity integrated over 8–1000 μm. The yellow highlighted regions correspond to the 95% confidence intervals.
Other Images in This Article
Copyright and Terms & Conditions
© 2024. The Author(s). Published by the American Astronomical Society.