Image Details
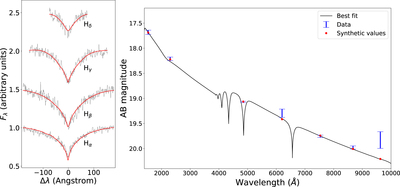
Caption: Figure 3.
Left: Gemini-North GMOS spectrum for WD1, isolating the first four Balmer lines (black). The DA atmospheric model (Tremblay et al. 2011) fit is superimposed in solid red. Right: Photometric fit of WD1 using available Galex and Pan-STARRS photometry with 1σ error bars (blue). Black lines shows the synthetic spectrum computed from the best fit, with synthetic photometry shown in red.
Other Images in This Article

Copyright and Terms & Conditions
© 2023. The Author(s). Published by the American Astronomical Society.
Copyright ©
2025 Astronomy Image Explorer. All Rights Reserved.