Image Details
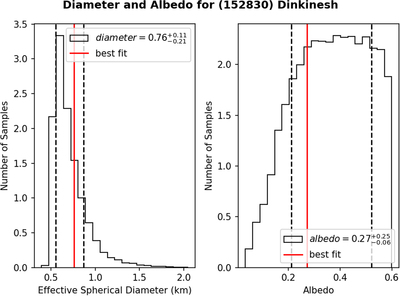
Caption: Figure 3.
We determined the effective spherical diameter (left) and visual geometric albedo (right) for Dinkinesh. The histograms represent the probability distribution functions from the Monte Carlo Markov Chain trials. The red line represents the best fit from the Monte Carlo Markov Chain trials to probe the probability distribution for both parameters. The two dashed lines represent the 16th and 84th percentiles.
Other Images in This Article
Copyright and Terms & Conditions
© 2023. The Author(s). Published by the American Astronomical Society.
Copyright ©
2025 Astronomy Image Explorer. All Rights Reserved.