Image Details
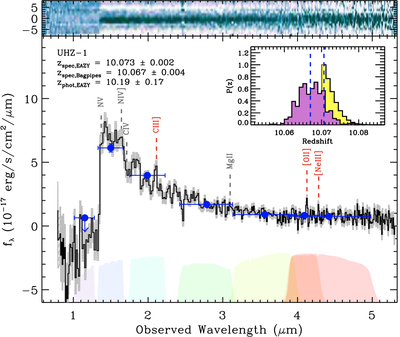
Caption: Figure 2.
JWST/NIRSpec Prism spectroscopy of UHZ-1. Upper panel: 2D MSA Prism spectroscopy produced by msaexp. Lower panel: 1D spectral extraction in f λ (in units of 10−17 erg s−1 cm−2 μm−1) with associated statistical uncertainties (gray shaded region). Slit-loss corrections are defined by convolution of the JWST photometry with the Prism spectrum (see Section 2). Prominent and/or expected emission features are highlighted assuming z spec = 10.07 with significant >3σ detections and nondetections labeled in red and gray, respectively. Overlaid are the JWST/NIRCam photometry (blue circles) with associated filter responses highlighted. Inset panel: redshift probability distributions for fits to the NIRSpec spectroscopy produced by EAZY (yellow) and BAGPIPES (purple) packages.
Other Images in This Article
Copyright and Terms & Conditions
© 2023. The Author(s). Published by the American Astronomical Society.