Image Details
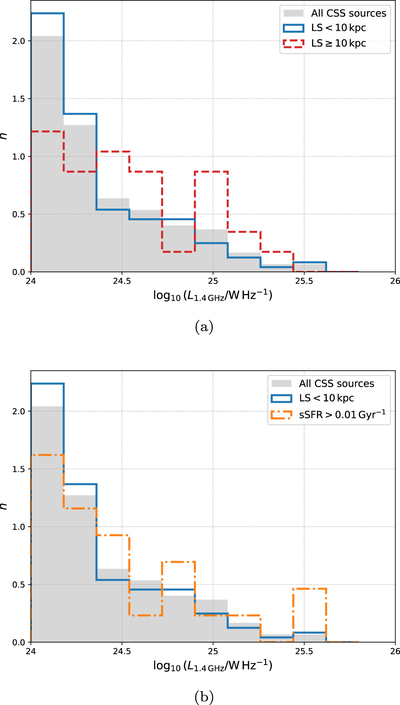
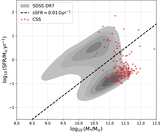
Caption: Figure 5.
Normalized distributions of L 1.4 GHz for subsamples of our CSS sources. Both panels show the full CSS sample as a solid gray histogram, and the CSS sources with LS < 10 kpc as blue solid line. Panel (a) shows a comparison with sources having LS ≥ 10 kpc (red dashed line), while Panel (b) shows the radio luminosities of CSS sources with sSFR > 0.01 Gyr−1 (orange dotted–dashed line).
Other Images in This Article

Copyright and Terms & Conditions
© 2023. The Author(s). Published by the American Astronomical Society.
Copyright ©
2025 Astronomy Image Explorer. All Rights Reserved.