Image Details
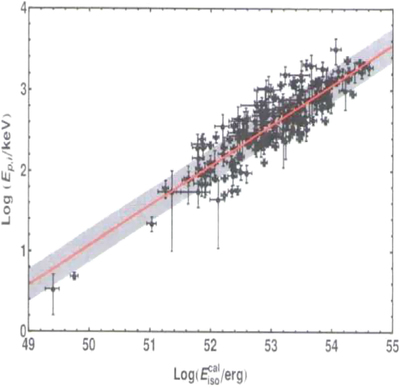
Caption: Figure 4.
The best-fit Amati correlation (red line) between recalibrated values of (1 + z)E p and E iso of GRBs (black data points), within 1σ and 3σ limits (shaded region) adapted from Amati et al. (2019).
Other Images in This Article
Copyright and Terms & Conditions
© 2022. The Author(s). Published by the American Astronomical Society.
Copyright ©
2025 Astronomy Image Explorer. All Rights Reserved.