Image Details
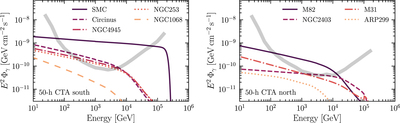
Caption: Figure 2.
Most likely gamma-ray spectral energy distributions of different galaxies as a function of gamma-ray energy, in agreement with their star-forming activities and current gamma-ray observations. The left (right) panel collects the galaxies of the southern (northern) sky. The thick lines show the CTA differential sensitivity for an observation time of 50 hr (Acharya et al. 2018).
Other Images in This Article
Copyright and Terms & Conditions
© 2021. The American Astronomical Society. All rights reserved.
Copyright ©
2025 Astronomy Image Explorer. All Rights Reserved.