Image Details
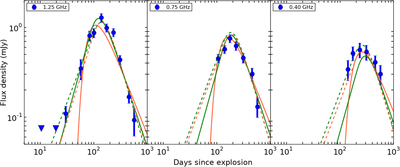
Caption: Figure 2.
The uGMRT light curves of AT 2018cow at 0.40, 0.75, and 1.25 GHz frequencies. The green and red solid lines denote the best-fit SSA and FFA models, respectively. The green and red dotted lines denote the best-fit inhomogeneous SSA and FFA models, respectively.
Other Images in This Article

Copyright and Terms & Conditions
© 2021. The American Astronomical Society. All rights reserved.
Copyright ©
2025 Astronomy Image Explorer. All Rights Reserved.