Image Details
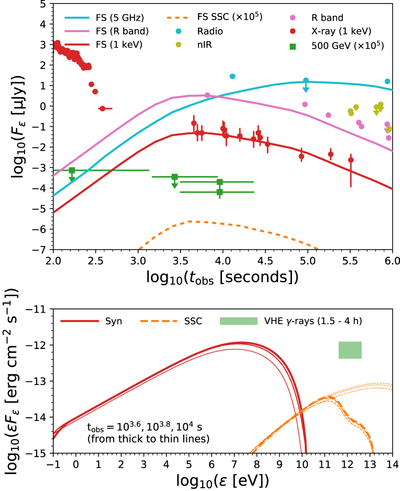
Caption: Figure 1.
Top panel: multiwavelength light curves from radio, optical, X-ray, and VHE bands at 500 GeV in the SSC scenario. The radio and optical are taken from Lamb et al. (2019) and Troja et al. (2019), late-time X-ray data are taken from Acciari et al. (2020), while the early X-ray data at extended emission phase are taken from the public online repository assuming spectral index ΓX = 2.5 (Evans et al. 2010). The green circles are the upper limit of the flux at 500 GeV assuming a power-law spectrum with spectral index Γγ = 2 (Acciari et al. 2020). Bottom panel: energy spectra at t = 103.6–104 s for different components, synchrotron emission, and SSC emission. The thick dashed lines take into account both the internal γγ absorption and EBL attenuation (Kneiske et al. 2004), while the thin lines ignore the EBL attenuation. The rectangle band shows the integrated flux level measured by MAGIC from 1.5 to 4 hr (Acciari et al. 2020). The physical parameters are ﹩{{ \mathcal E }}_{k}=3\times {10}^{51}\,\mathrm{erg}﹩, Γ0 = 40, nex = 0.05 cm−3, ϵe = 0.3, ϵB = 10−5, fe = 0.5, s = 2.3, and θj = 0.15.
Other Images in This Article
Copyright and Terms & Conditions
© 2021. The American Astronomical Society. All rights reserved.