Image Details
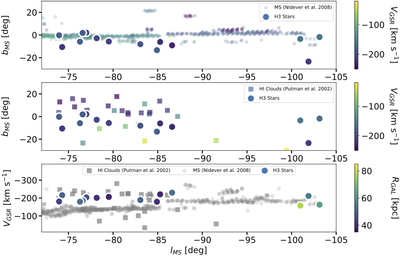
Caption: Figure 3.
Distribution of stars and gas in the Magellanic Stream tip region. In the upper panel we plot the distribution of stars (large circles) and the MS (from Nidever et al. 2008; small circles), while in the middle panel we plot the same stars and compact clouds from Putman et al. (2002; squares). We present the data in Magellanic Stream coordinates from Nidever et al. (2008). All symbols are color coded according to VGSR in the top two panels. In the lowest panel we plot the same objects as in the top two panels in different coordinates (VGSR vs. Magellanic Stream longitude). Symbols remain the same, but the color coding reflects RGAL only for the stars (otherwise symbols are gray because distances to the gas are unknown).
Other Images in This Article
Copyright and Terms & Conditions
© 2020. The American Astronomical Society. All rights reserved.